Project goal:
- Automatic deployment of the Prometheus federation environment
- Visualization of metrics using Grafana platforms
- Showing the possibility of Prometheus in the Hierarchical Federation configuration
Used tools: Vargrant, Ansible, Prometheus, Grafana, Mysql, node_exporter, mysql_exporter
Use cases
Federation allows a Prometheus server to scrape selected time series from another Prometheus server.
There are different use cases for federation. Commonly, it is used to either achieve scalable Prometheus monitoring setups or to pull related metrics from one service’s Prometheus into another.
Hierarchical federation
Hierarchical federation allows Prometheus to scale to environments with tens of data centers and millions of nodes. In this use case, the federation topology resembles a tree, with higher-level Prometheus servers collecting aggregated time series data from a larger number of subordinated servers.
For example, a setup might consist of many per-datacenter Prometheus servers that collect data in high detail (instance-level drill-down), and a set of global Prometheus servers which collect and store only aggregated data (job-level drill-down) from those local servers. This provides an aggregate global view and detailed local views.
In our case we will use two Prometheus server - each one for another datacenter and one global to collect only specific type of metrics intended for senior managers - in our case - for analyzing the load on the databases - comparison two environment - eg PROD and DEV
Prerequisites:
You must have installed:
- Virtual Box
- Vagrant tool made by Hashi Corp
- Vagrant is a tool for building and managing virtual machine environments in a single workflow. With an easy-to-use workflow and focus on automation, Vagrant lowers development environment setup time, increases production parity, and makes the “works on my machine” excuse a relic of the past. https://www.vagrantup.com/
- VirtualBox is a powerful x86 and AMD64/Intel64 virtualization product for enterprise as well as home use. https://www.virtualbox.org/
Instalation:
- mkdir /your_path/prometheus; cd /your_path/prometheus
- git init
- git clone https://github.com/ITAndreHoch/Prometheus-federation.git
- cd Prometheus-federation
- vagrant up
Access to Grafana WEB GUI:
| Username | Password | Port |
|---|---|---|
| admin | admin | 3000 |
Access to individual servers: vagrant ssh “name of machine” eg. vagrant ss prometheus1 ; sudo su -
check status: vagrant status
All components will automatically deploy like: servers, os, application, and configuration. Important: Configuration of Grafana - DATASOURCES, DASHBORD will be also implemented.
Target configuration:
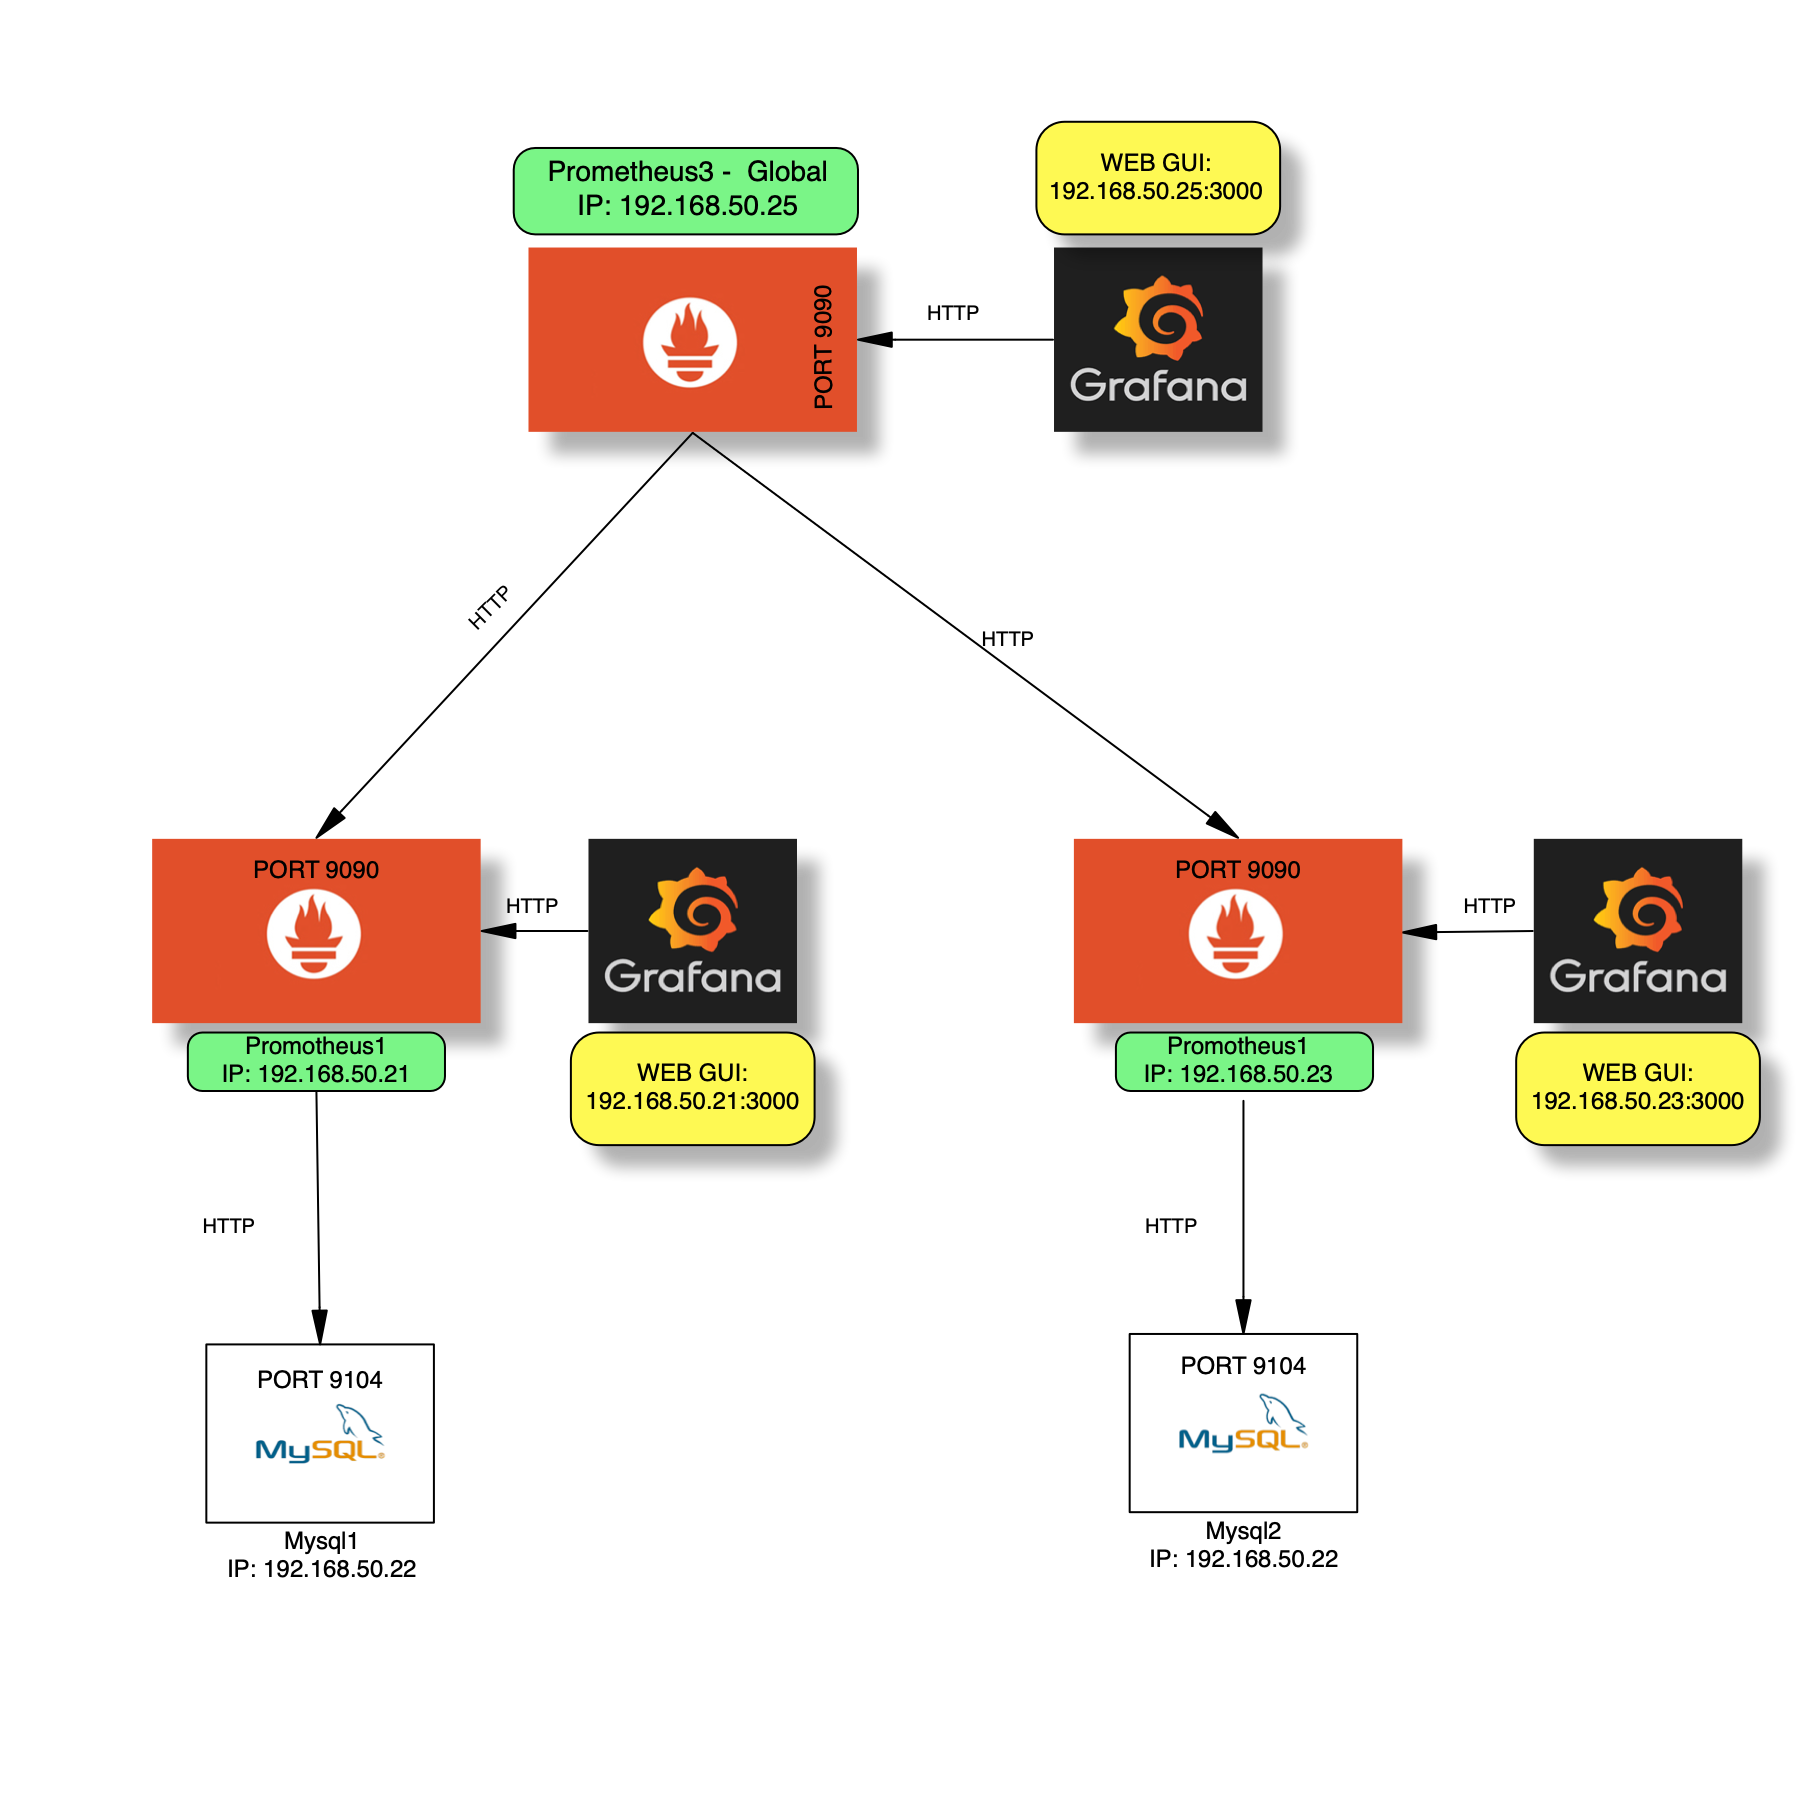
The environment consists of 5 virtual machines:
- 3 servers with installed: Prometheus, Grafana-Server, Node_exporter
- 2 servers with installed: MySQL server, Mysql_exporter
The assumption of the project is a collection of all metrics from the MYSQL database (for a given datacenter) - and downloading only selected by global Prometheus.
Infrastructure diagram:

Components:
DataCenter1:
- Prometheus1-[192.168.50.21], Mysql1-[192.168.50.22], Grafana-[192.168.50.21]
DataCenter2:
- Prometheus2-[192.168.50.23], Mysql2-[192.168.50.24], Grafana-[192.168.50.23]
DataCenter: Global:
- Prometheus3-[192.168.50.25], Grafana-[192.168.50.25]
Configuration
All configuration files are in the repository - all of them will be automatically placed on the appropriate virtual machines. Below is the configuration for Vagrant as well as the sample files tasks.yaml for prometheus1.
Vagrant file:
```# -- mode: ruby --
vi: set ft=ruby :
Vagrant.configure(“2”) do |config| config.vm.box = “centos/7”
config.vm.define “mysql1” do |mysql1| mysql1.vm.network “private_network”, ip: “192.168.50.22” mysql1.vm.hostname = “mysql1” mysql1.vm.provider :virtualbox do |vb| vb.name = “mysql1” end mysql1.vm.provision “ansible_local” do |ansible| ansible.install = true ansible.compatibility_mode = “2.0” ansible.playbook = “mysql1.yml” end end
config.vm.define “prometheus1” do |prometheus1| prometheus1.vm.network “private_network”, ip: “192.168.50.21” prometheus1.vm.hostname = “Prometheus1” prometheus1.vm.provider :virtualbox do |vb| vb.name = “Prometheus1” end prometheus1.vm.provision “ansible_local” do |ansible| ansible.install = true ansible.compatibility_mode = “2.0” ansible.playbook = “prometheus1.yml” end end
config.vm.define “mysql2” do |mysql2| mysql2.vm.network “private_network”, ip: “192.168.50.24” mysql2.vm.hostname = “mysql2” mysql2.vm.provider :virtualbox do |vb| vb.name = “mysql2” end mysql2.vm.provision “ansible_local” do |ansible| ansible.install = true ansible.compatibility_mode = “2.0” ansible.playbook = “mysql2.yml” end end
config.vm.define “prometheus2” do |prometheus2| prometheus2.vm.network “private_network”, ip: “192.168.50.23” prometheus2.vm.hostname = “Prometheus2” prometheus2.vm.provider :virtualbox do |vb| vb.name = “Prometheus2” end prometheus2.vm.provision “ansible_local” do |ansible| ansible.install = true ansible.compatibility_mode = “2.0” ansible.playbook = “prometheus2.yml” end end
config.vm.define “prometheus3” do |prometheus3| prometheus3.vm.network “private_network”, ip: “192.168.50.25” prometheus3.vm.hostname = “Prometheus3” prometheus3.vm.provider :virtualbox do |vb| vb.name = “Prometheus3” end prometheus3.vm.provision “ansible_local” do |ansible| ansible.install = true ansible.compatibility_mode = “2.0” ansible.playbook = “prometheus3.yml” end end end
To automatic provision & deploy we are using ***ANSIBLE*** which is a radically simple IT automation engine that automates cloud provisioning, configuration management, application deployment, intra-service orchestration, and many other IT needs.

**roles/prometheus1/tasks/installation.yml:**
-
name: Update system yum: name: ‘*’ state: latest
-
name: Installation multiple packages yum: name: net-tools state: present
- name: Add Prometheus repositpory
yum_repository:
name: Prometheus
description: Prometheus repository
baseurl: https://packagecloud.io/prometheus-rpm/release/el/7/$basearch/
file: prometheus
gpgkey:
- https://packagecloud.io/prometheus-rpm/release/gpgkey
- https://raw.githubusercontent.com/lest/prometheus-rpm/master/RPM-GPG-KEY-prometheus-rpm gpgcheck: yes enabled: yes
-
name: Add Grafana repository yum_repository: name: grafana description: Grafana repository baseurl: https://packagecloud.io/grafana/stable/el/7/$basearch file: grafana gpgkey: https://packagecloud.io/gpg.key https://grafanarel.s3.amazonaws.com/RPM-GPG-KEY-grafana gpgcheck: yes enabled: yes sslcacert: /etc/pki/tls/certs/ca-bundle.crt notify: yum-clean-metadata
-
name: Installation Prometheus, Node_expoerter, Grafana yum: name: - prometheus - node_exporter - grafana state: present
-
name: Inserting cofiguration for prometheus blockinfile: path: /etc/prometheus/prometheus.yml block: “” dest: “/etc/prometheus/prometheus.yml” backup: yes
- name: Starting services Prometheus, node_exporter, grafana
systemd:
name: “”
state: started
enabled: yes
daemon_reload: yes
with_items:
- ‘prometheus’
- ‘node_exporter’
- ‘grafana-server’
**Prometheus-federation/roles/prometheus1/tasks/configuration.yml:**
-
name: Grafana - copy DATASOURCE YAML copy: src: datasource.yaml dest: /etc/grafana/provisioning/datasources/datasource.yaml owner: grafana group: grafana mode: 0640
-
name: Creating Grafana Dashboard Dir file: path: /var/lib/grafana/dashboards state: directory owner: grafana group: grafana mode: 0775
-
name: Grafana - dasboard Provisioning file copy: src: dashboardConfig.yaml dest: /etc/grafana/provisioning/dashboards/dashboardConfig.yaml owner: grafana group: grafana mode: 0640
-
name: Grafana - copy MySql dashbord JSON file copy: src: mysql.json dest: /var/lib/grafana/dashboards/dashboard.json owner: grafana group: grafana mode: 0640 notify: reload-grafana
```
Data Flow:
The Prometheus1 and Prometheus2 servers scrapes targets from Mysql1/2 - in that case ALL MYSQL metrics (exported by msql_exporter - port 9104).
Prometheus3 (Global Datacenter) scrape selected time series (job: mysql_exporter) from Prometheus1/2servers. IMPORTANT: Prometheus3 collects only SELECTED METRICS - in this case MYSQL. The rest - like Prometheus, Node are not downloaded). This is Hierarchical federation which allows Prometheus to scale to environments with tens of data centers and millions of nodes. In this use case, the federation topology resembles a tree, with higher-level Prometheus servers collecting aggregated time series data from a larger number of subordinated servers.
Example in practice:
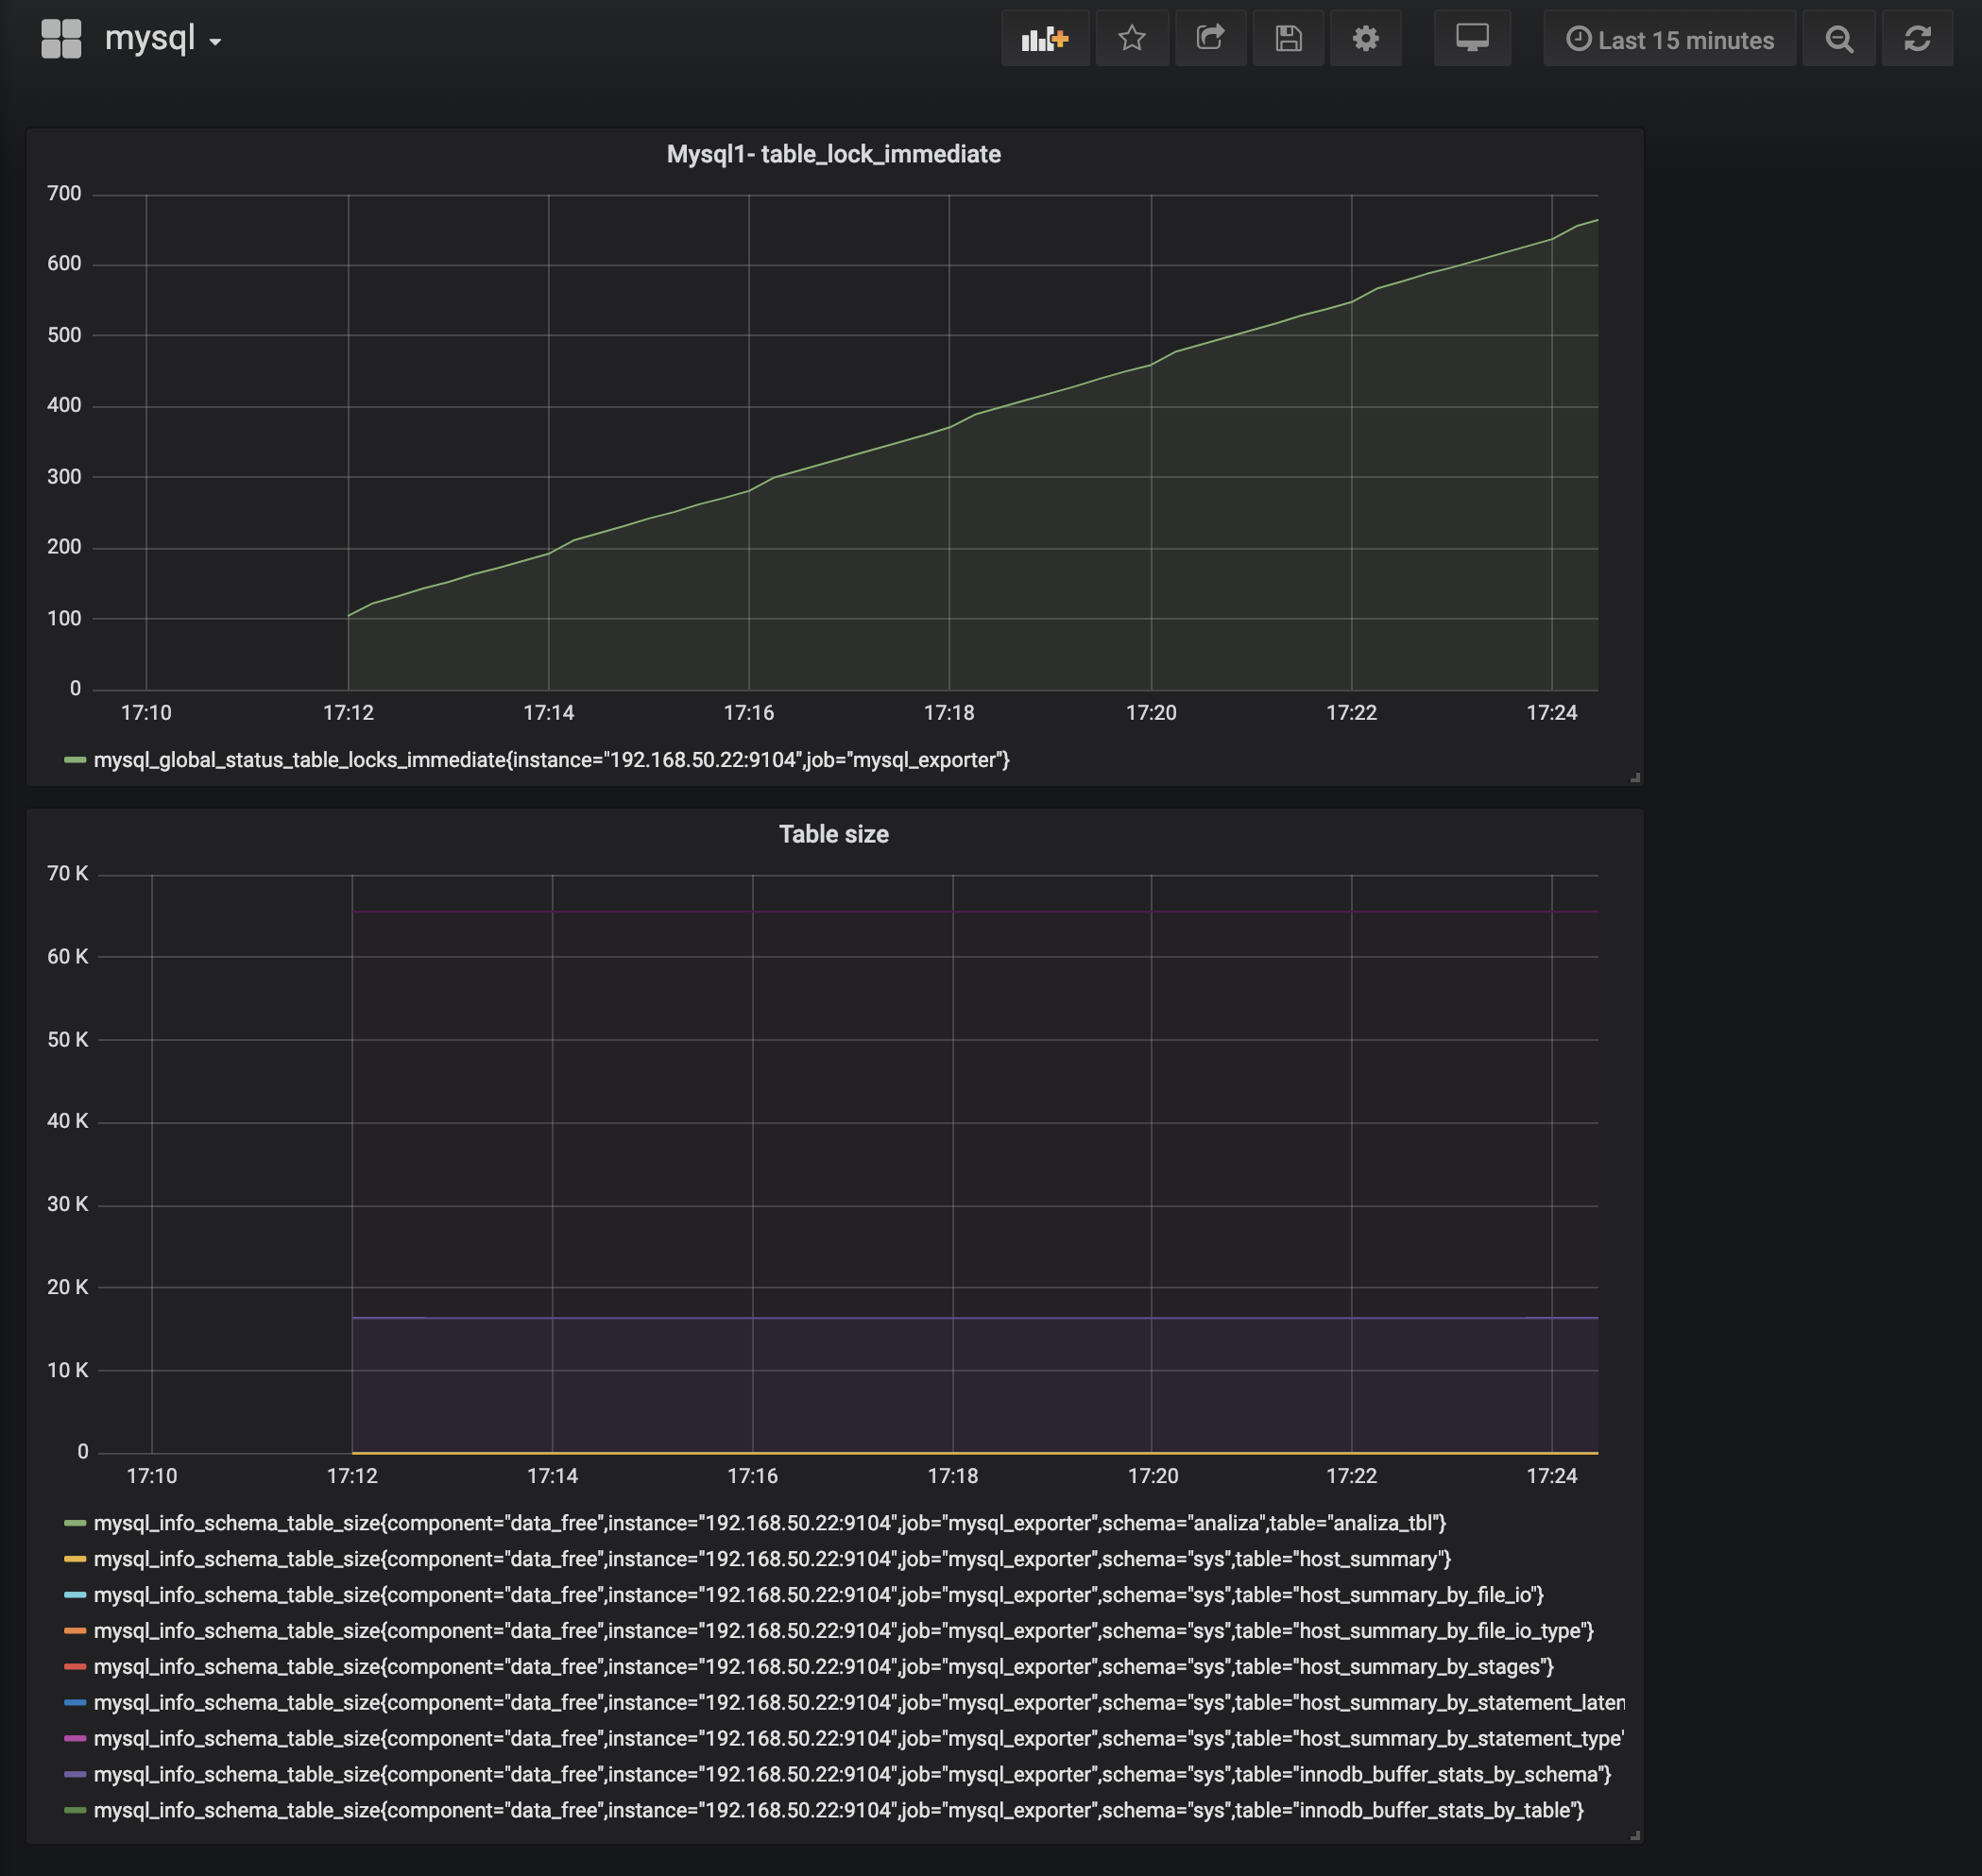
Below is a drawing showing mysql dashboard (grafan server - data from prometheus1: 192.168.50.3000)

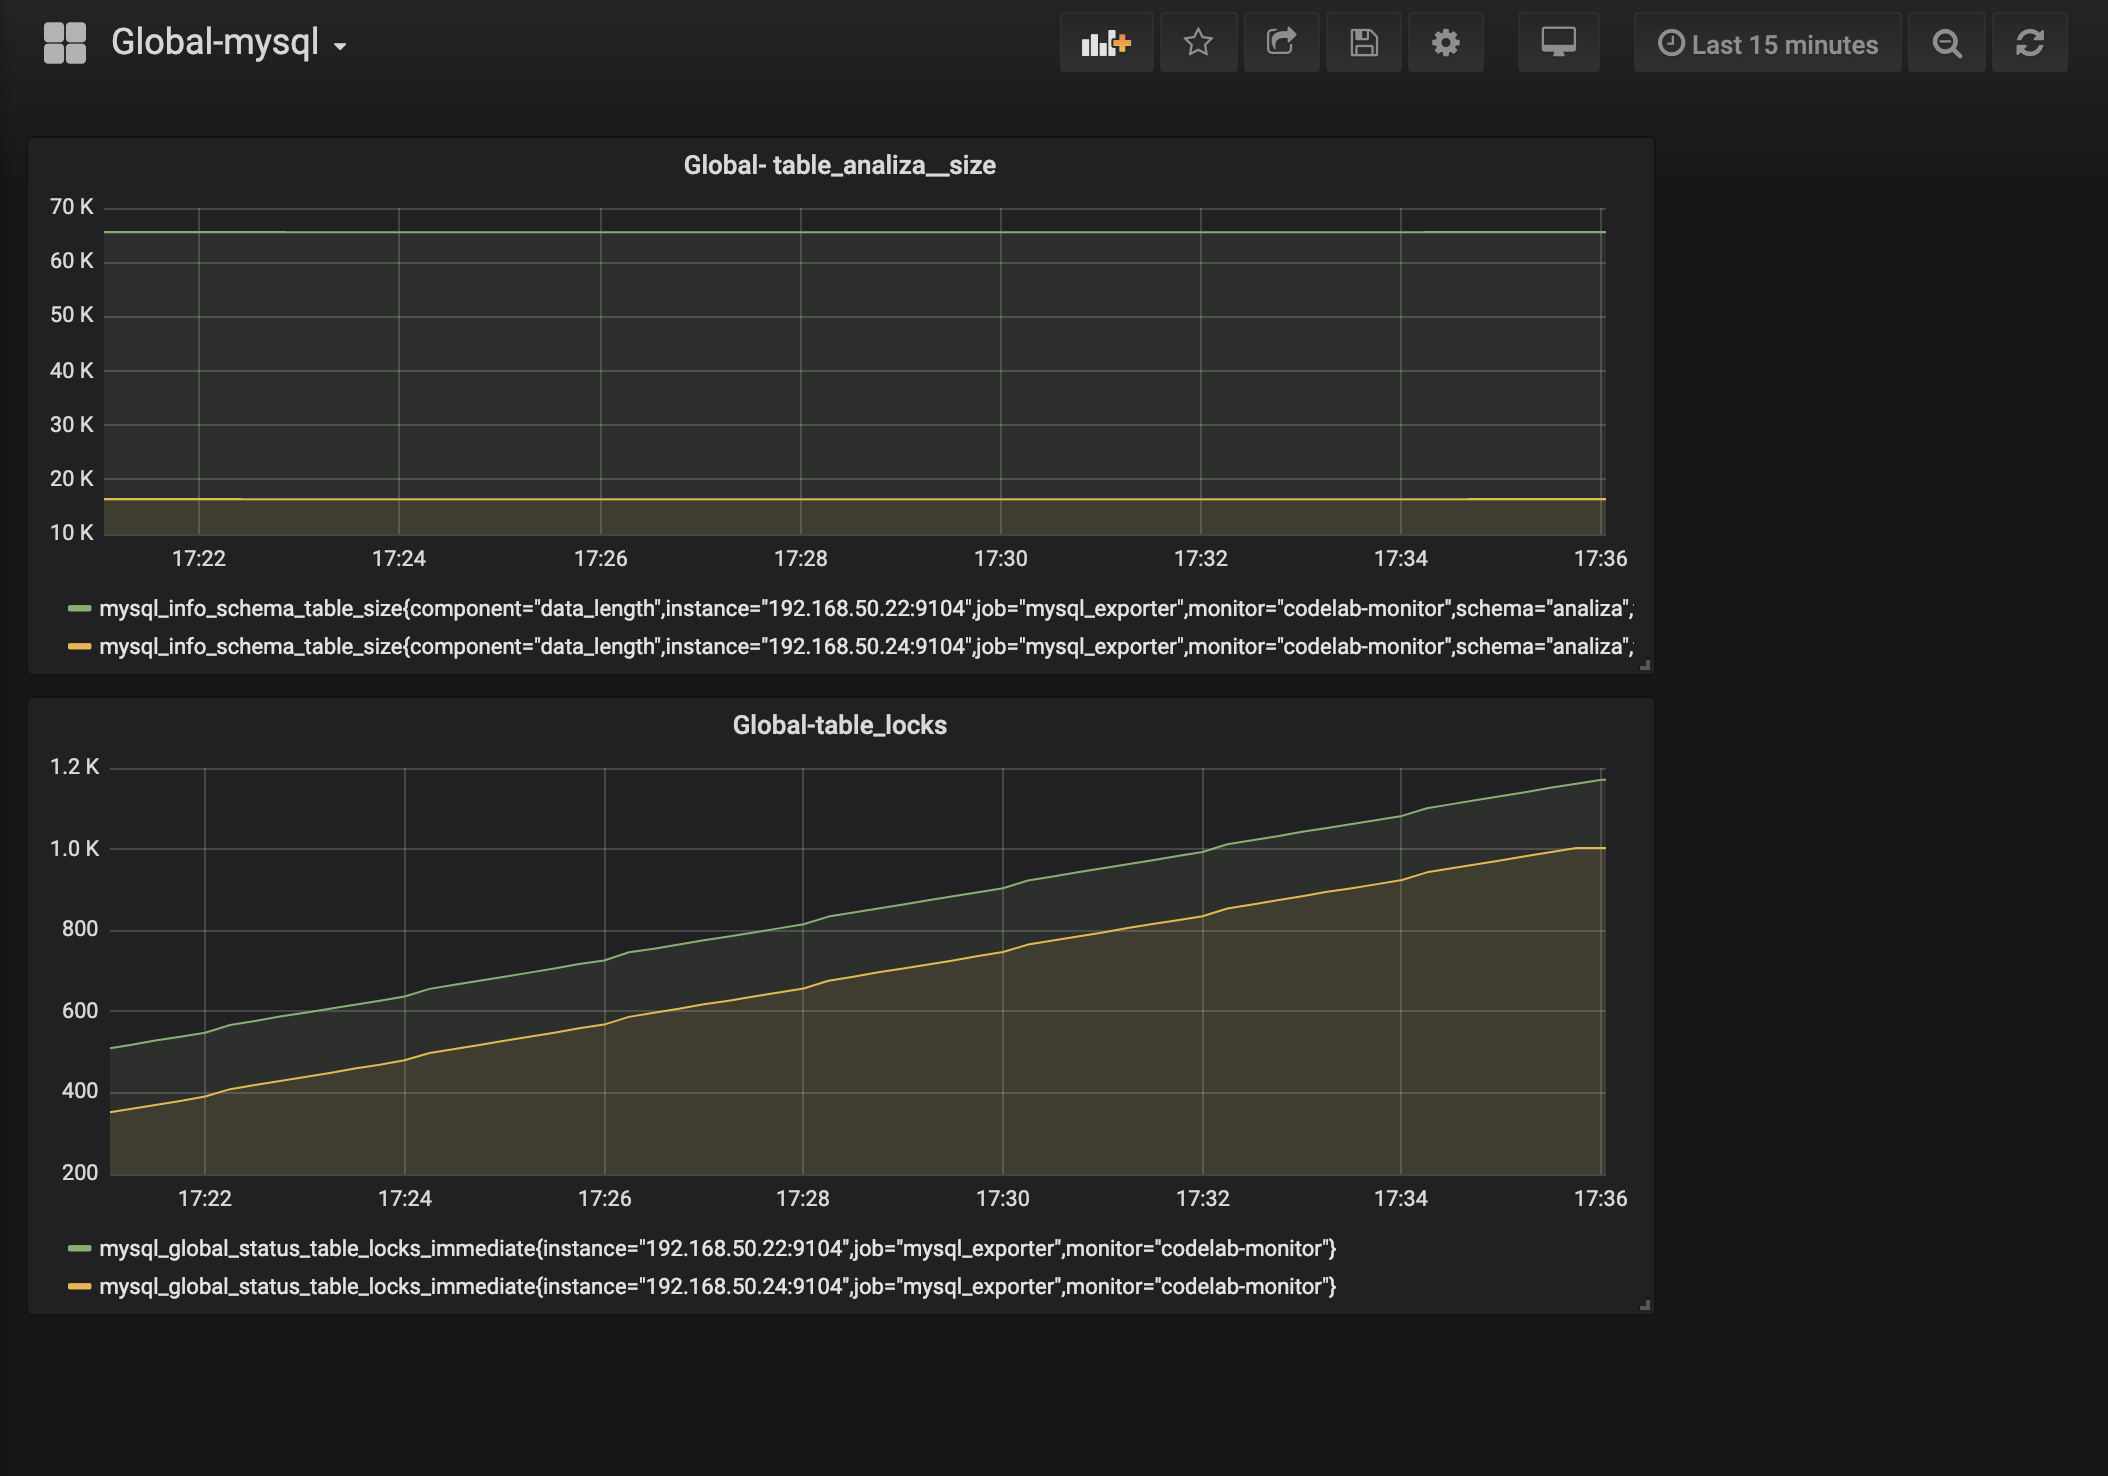
and now - dashboard Global-mysql from prometheus3 (Grtafana: 192.168.50.25:3000) which presents SPECIFIC, SELECTED metrics from both servers - in this case, to compare the size of the ANALIZA table
